Cost audit for AI-built prototypes: cut API and DB spend
Cost audit for AI-built prototypes helps you spot the endpoints, queries, and background jobs inflating bills, then fix the top few fast.
What is actually driving your bill?
Many AI-built prototypes get expensive for a simple reason: they demo fine, but they waste money in the background. Code generators often duplicate calls, skip caching, and add “helpful” polling that never stops. You don’t notice until real users arrive, or a few testers leave the app open all day.
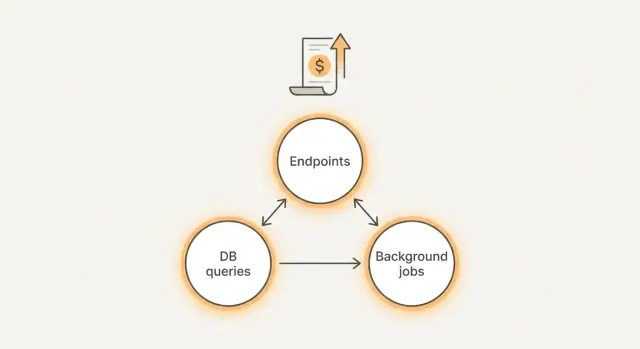
Most surprise spend comes from three places:
- Endpoints: one screen triggers too many API calls, retries, or oversized responses.
- Queries: slow or unbounded database queries that scan far more data than needed.
- Background tasks: cron jobs, queue workers, and webhooks that run too often or never stop.
“Good” spend is boring. It’s predictable and moves with real product activity. If you have 10x more active users, costs may rise, but the jump makes sense. “Bad” spend grows when nobody is doing anything, or when one feature quietly triggers hundreds of calls.
If you only have 30 minutes, measure the few things that reveal problems fast:
- Top endpoints by request count and average response size
- Slowest and most frequent database queries
- Background jobs by run frequency and average runtime
- Third-party API calls by endpoint and error or retry rate
- Baseline spend during “no one is using it” hours
A quick reality check helps: open the app, do one normal action (like loading a dashboard), and watch what fires. If that single action triggers 20 requests, three long queries, and a job queue spike, you’ve found your starting point.
Tie spend to real features (not to vague "usage")
Dashboards that show “API calls” or “DB reads” don’t tell you what to fix. This gets easier when you translate spend into real product actions a user takes.
Make a simple cost map
Write down the handful of actions that are allowed to cost money, and treat everything else as suspicious until proven necessary. For many prototypes:
- Signup and login (email, SMS, OAuth)
- Search and filters
- Chat or content generation
- Reports and exports
- File uploads and processing
Attach a rough expectation to each action: “A chat message should cost less than X,” or “A report run should take less than Y seconds.” You don’t need perfect numbers. You need targets that make waste obvious.
Next, separate user-driven costs from always-on costs.
User-driven costs happen only when someone clicks a button. Always-on costs run even when nobody is using the app: cron jobs, queue workers, background polling, auto-retries, and “health checks” that hit expensive endpoints. Always-on costs are often the fastest win because they can burn money 24/7.
Also check which environment is spending money. AI-built apps often point dev or staging at the same paid services as production, or leave test workers running overnight. If you can’t clearly say “this cost is prod,” assume some of it isn’t.
Set your goal before touching code:
- Cut 20% this week (turn off the biggest waste)
- Cut 80% this month (rework architecture, caching, and data access)
A common pattern: a “report” feature is used once per day, but a background task generates it every 5 minutes for every account. The dashboard shows “high DB usage,” but the real problem is a feature nobody asked for running constantly.
Step by step: inventory endpoints, queries, and jobs
The goal is to stop guessing. You want a map of every place your app spends money, tied to real requests and real work.
Pick one normal day of traffic and treat it as your baseline. If you don’t have much traffic yet, use a day of internal testing where you exercise the main flows (signup, checkout, search, chat, uploads). Save this baseline so you can compare after changes.
Build a one-page inventory
Work through the app in three buckets: endpoints, database queries, and background work.
- Endpoints
- List every API route (including internal routes) and note who calls it: browser, mobile app, cron job, webhook, or another service.
- Add rough volume and latency. Exact numbers are great, but “high/medium/low” and “fast/slow” is enough to spot the first problems.
- Queries
- For each endpoint, capture the top database queries it triggers.
- Sample from logs, tracing, or your DB slow query view, and write down the query shape (tables touched, filters, joins).
- Background work
- Write down every scheduled job, webhook handler, and queue worker.
- Include how often it runs and what it does (sync, email, embeddings, cleanup).
Keep everything tied to your baseline day so you can estimate cost per 1,000 requests or per active user.
Once you have this list, patterns jump out: one endpoint is called on every page load, a “small” query scans a big table, or a background job runs every minute even when nothing changes.
Endpoints that quietly get expensive
Some of the biggest leaks hide in “normal” endpoints that get called all day. Often the backend isn’t expensive per request. It’s expensive because the same request happens hundreds or thousands of times.
A common culprit is polling: the frontend checks for updates every few seconds, even when nothing changes. Refresh loops can also happen by accident, like when a page re-renders and triggers another fetch, or when two components call the same endpoint without knowing it. If users keep a tab open, that quiet loop becomes a steady meter.
Another pattern is an endpoint that does too much work per request. AI-generated code may bundle multiple lookups, extra joins, or file processing into a single route “for convenience.” It works in a demo, but every call triggers a chain of database queries and third-party API calls.
Read-heavy routes get costly when there’s no caching. If an endpoint returns the same data for many users (pricing, settings, a list of templates), you pay repeatedly for identical reads.
Retries multiply costs fast. If timeouts are too short, or rate limits are missing, clients may retry aggressively. You end up paying twice (or more) for the same action.
A few signs an endpoint deserves attention first:
- It’s called on a timer (polling) or on every keypress
- It triggers multiple downstream calls (DB plus external APIs)
- It returns the same response often but has no caching
- It times out sometimes and clients retry automatically
- It has no rate limit, so bursts turn into expensive spikes
Example: a /messages endpoint in a chatbot prototype is called every 2 seconds to check for new replies. On top of that, it recalculates conversation context and hits the database several times. Fixing call frequency and moving heavy work out of the request can cut spend immediately.
Queries that spike your database costs
Database spend often comes from a small number of queries that run far more than you think. AI-generated code can also hide inefficiency behind an ORM, so the app looks fine in testing but gets expensive with real traffic.
One of the biggest culprits is the N+1 pattern: you fetch a list of items, then the code quietly fetches related data one row at a time inside a loop. A page that shows 50 orders can turn into 51 queries (or 201 if each order pulls customer and items), and every refresh repeats the work.
Missing indexes are another common multiplier. If you filter by fields like user_id, created_at, or status, or join on foreign keys, the database shouldn’t scan the whole table each time. When the index is missing, costs rise as data grows, so it gets worse every week.
Also watch for queries that pull too much. Selecting every column, loading large JSON blobs, or returning thousands of rows when the UI only shows the first 20 wastes CPU, memory, and network. Search, activity feeds, and admin tables are frequent offenders, especially when pagination is forgotten.
Five checks that usually find the worst spikes:
- Look for repeated reads inside loops (N+1) in logs or traces
- Verify indexes exist for common filters and join keys
- Select only needed columns, not
SELECT * - Add pagination and hard limits for scroll and search
- Confirm connection pooling is set, so you don’t open a new DB connection per request
Example: a chatbot prototype stores messages and “loads the last 5,000” on every page view to build context. Changing it to fetch the last 30 messages, indexing conversation_id, and batching related lookups can drop database load fast.
Background tasks that run more than you think
Background tasks are a common reason an AI prototype looks cheap in testing, then gets expensive in production. They run when nobody is using the app, and they often touch the most costly parts of your stack: external APIs, your database, and file storage.
Start by listing every job that runs on a timer and write down its schedule in plain language. “Every minute” and “every 5 minutes” are common budget killers, especially when the job calls paid APIs or scans large tables.
Next, look for jobs that run even when there’s no work to do. A typical example is a “sync” task that checks for new data, but still fetches thousands of rows or calls an API even when nothing changed. Simple guards before the expensive parts are often enough to stop the bleed.
Fan-out behavior is the other silent multiplier. One scheduled job might enqueue a job per user, per workspace, or per record. If it runs hourly and you have 2,000 users, you’re suddenly running 48,000 jobs per day.
A few fixes that tend to cut spend quickly:
- Add a “no work” check (queue length, last updated timestamp, or a cheap count) before any heavy query or API call
- Cap fan-out with batching (process 100 records at a time) and backoff when the system is busy
- Make jobs idempotent so retries don’t repeat expensive work (use a unique job key or a processed marker)
- Put counts and durations in logs: items processed, API calls made, rows scanned, total runtime
How to pick the few fixes that cut spend fast
An audit only matters if it turns into a short, focused plan. The goal isn’t to make everything perfect. It’s to remove the few hotspots that create most of the bill.
For each candidate change, write down two things: how hard it is, and how much it could save. Keep it lightweight so you can decide quickly.
- Add request limits to costly endpoints (small effort, high savings)
- Cache read-heavy responses for 60 seconds (small effort, medium to high savings)
- Add a DB index to a top query (medium effort, high savings)
- Reduce polling frequency in a worker or UI (small effort, medium to high savings)
- Refactor a whole module (large effort, savings uncertain)
Prioritize fixes that reduce one of these drivers:
- Number of API calls (fewer requests, fewer retries, smaller responses)
- Rows scanned (faster queries, fewer full table scans)
- Job frequency (less polling, fewer scheduled runs)
Quick guardrails usually win first. Put a cap on abusive patterns (rate limits, timeouts, max page size). Add caching where data doesn’t change every second. For background work, switch from “check every minute” to “run when needed,” or move to a longer schedule.
Use a clear stop rule: ship 2-3 changes, then re-measure for a day (or a normal business cycle). If you can’t see a meaningful drop, go back to the inventory. Big rewrites are tempting, but they often miss the real cost driver.
Example: if a prototype chatbot re-sends the full conversation on every message, a small change like summarizing older messages or limiting history can cut token spend faster than rebuilding the whole chat feature.
Example: a chatbot prototype with runaway costs
A common case: a Lovable or Bolt prototype with a simple chat screen plus a dashboard for “usage” and “history.” It works in demos, but the bill grows faster than the user count.
Here’s the pattern. Every page load triggers several AI calls “just in case” (summaries, suggested prompts, sentiment, title generation). At the same time, the dashboard runs full table scans to rebuild stats from scratch. A few active testers create hundreds of calls per hour, and the database starts doing heavy reads that look like random spikes.
Often there’s one main culprit: a single chat endpoint that repeats embedding work on every message, sometimes more than once per request. It might embed the user text, re-embed the last N messages, and re-embed the same knowledge base chunks because nothing is cached. If the endpoint also stores everything and then immediately queries “all messages for this user” without limits, query cost grows with every conversation.
Fixes that cut spend tend to be boring but effective:
- Debounce UI triggers so one user action makes one request, not five
- Cache embeddings and reuse them when text hasn’t changed
- Add pagination and limits to message history and dashboard tables
- Move “nice to have” AI work (titles, summaries) into scheduled jobs that run less often
- Add guardrails: timeouts, max tokens, and rate limits per user
The result to look for is fewer calls per user action and a flatter cost curve. After these changes, you should be able to predict spend from active users, instead of being surprised by a single busy afternoon.
Common mistakes to avoid during a cost audit
A cost audit can go sideways if you treat it like a spreadsheet exercise instead of a hunt for the few things that generate most of the bill. The goal isn’t perfect measurement. It’s fast, safe savings.
One trap is collecting lots of metrics while missing the obvious. Teams track every route, every table, every dashboard, then never act on the worst offenders. In practice, your top 5 endpoints and top 5 queries often explain most of the spend.
Another mistake is fixing the wrong layer. You can optimize a slow query, but if a background job calls it every minute (or runs twice because of retries), the bill won’t move. Always confirm what triggers the work: user actions, cron schedules, webhooks, retries, or queue workers.
Watch for these failure patterns:
- You disable a feature to cut costs, but the real issue is an accidental call loop or a client that polls too often
- You tune one query while an export job or sync job runs the same query thousands of times
- You chase savings and accidentally break correctness (partial data, missing writes, stale cache)
- You skip basic security checks and ship exposed secrets, weak auth, or injection risks
- You “fix” cost by lowering limits without addressing why the app hits those limits
Example: a prototype “notifications” feature looks expensive, so it gets turned off. Later you find the real culprit was a worker that re-sent the same batch because the job never saved its checkpoint.
Quick checklist: before and after you change anything
Treat this like a small experiment: measure first, change one thing, measure again. Otherwise you risk “saving money” on paper while breaking sign-in, slowing pages, or causing retries that cost even more.
Pick one baseline day (or a typical 24-hour window) and write down your numbers in one place: total API spend, database spend, and background worker spend, plus a few top offenders.
Before you change any code, make sure you can answer these:
- What are the top 3 endpoints by cost and by volume (requests)?
- What are the top 3 queries by total time or rows scanned?
- Do you have a complete list of scheduled jobs, queues, and cron tasks, plus how often they run?
- Did you record “before” numbers for a baseline window (spend, latency, error rate, retries)?
- Do you know what “good” looks like for users (page load time, time to first response, successful checkout or login rate)?
After you make changes, re-check the same window and add two extra checks: retries and user experience. A common trap is reducing compute per request but introducing 500 errors, timeouts, or auth failures that trigger automatic retries. One broken endpoint can double traffic and costs without any new users.
Also verify you didn’t just move cost somewhere else (for example: fewer API calls but heavier DB queries, or fewer DB reads but more background jobs).
Next steps if your AI-built prototype is hard to untangle
If your audit says “everything is expensive,” the problem is usually the code, not the cloud. AI-generated projects often ship with tangled routing, duplicated logic, and hidden retries. Before you optimize line by line, do a short diagnosis to map what actually runs in production and how requests flow.
Start by finding hotspots. If you only have 1-3 clear offenders (one noisy endpoint, one slow query, one overactive job), patching is often the fastest win. If you uncover a dozen medium problems spread across many files, you’ll spend more time chasing symptoms than fixing the cause, and a small refactor is often cheaper.
A simple rule of thumb:
- Patch when the fix is isolated and testable (rate limit one endpoint, add caching, fix one N+1 query)
- Refactor when the same bug pattern repeats (copy-pasted data loading, multiple endpoints doing the same work, jobs triggering each other)
- Rebuild when basics are broken (auth is unreliable, secrets are exposed, architecture blocks safe changes)
If you bring in outside help, the handoff matters more than long explanations. Bring one baseline day (a normal 24 hours of traffic) and a short pack of facts:
- Endpoint list with request counts and worst offenders
- Top queries with average time and frequency
- Background job list with schedules and actual run counts
- Recent deploy notes (what changed when spend spiked)
If the code came from tools like Lovable, Bolt, v0, Cursor, or Replit and it’s hard to trace what’s calling what, FixMyMess (fixmymess.ai) can do a free code audit to map endpoints, queries, and jobs before you touch anything. From there, the focus is straightforward remediation: logic repair, security hardening, refactoring, and deployment preparation so the prototype behaves like production software, not a demo.
FAQ
My AI prototype bill is high—what should I check first?
Start by checking what keeps spending money when nobody is actively using the app. Compare a quiet overnight window to a busy hour, then look for a small set of hotspots: a few endpoints with very high request counts, a few database queries that dominate total time, and any background jobs that run on a tight schedule. If costs don’t drop during “no one is using it” hours, your fastest win is usually always-on work, not user features.
How do I set a baseline before I start changing code?
Pick a normal 24-hour period and record the numbers you can easily re-check later: total API spend, database spend, and background worker spend, plus the top offenders by volume and latency. The point is not perfect accounting; it’s having a “before” snapshot so you can tell if your changes actually lowered cost instead of shifting it somewhere else.
How do I tie cloud spend to a real feature instead of vague metrics?
Translate “usage” into real user actions like loading a dashboard, sending a chat message, running a report, or uploading a file. Then watch what each action triggers in production: requests fired, queries executed, job spikes, and third-party calls. When one simple action triggers a surprising chain of work, you’ve found what to fix next.
Why does polling make costs explode even with a few users?
Polling often looks harmless because each request is small, but it runs constantly and multiplies across open tabs and users. If the UI checks every few seconds for updates that rarely change, costs rise even when the product is “idle.” The usual fix is to reduce or remove polling and only fetch when something actually changes, or when the user explicitly requests refresh.
How do retries and timeouts quietly increase my spend?
Retries can double or triple your bill because you pay for the same work multiple times. This happens when timeouts are too aggressive, errors aren’t handled cleanly, or clients automatically retry without limits. Fixing it usually means using sane timeouts, adding rate limits, making requests idempotent, and ensuring failed calls don’t trigger expensive downstream work repeatedly.
What is the N+1 query problem, and how do I spot it?
The N+1 pattern is when your code fetches a list and then fetches related data one row at a time inside a loop. It might feel fine with small test data, but it scales terribly and gets expensive fast. The practical fix is to batch those lookups so one page load doesn’t create dozens or hundreds of separate queries.
When is adding a database index the best cost fix?
If you filter or join on fields like user IDs, timestamps, or statuses and the database scans a large table each time, you’ll see slow queries that get worse as data grows. Adding the right index usually gives a direct, measurable drop in query time and CPU use. The key is to index what your top endpoints actually filter and join on, not what “seems important.”
Why do background jobs cause “idle” spend overnight?
Because they run even when nobody is using the app, and they often touch expensive parts of your system like the database, paid APIs, and storage. A job that runs every minute can become a 24/7 cost leak, especially if it scans lots of rows or fans out work per user. Add a simple “no work to do” check and stop unnecessary fan-out to cut spend quickly without changing user-facing features.
How do I decide between patching, refactoring, or rebuilding?
Start with changes that are easy to test and reduce a clear driver like request count, rows scanned, or job frequency. Patch when the problem is isolated and you can confirm the impact in a day, like reducing polling or adding a cache for read-heavy data. Refactor when the same waste pattern repeats across multiple files, and rebuild when core foundations like auth, secrets handling, or architecture make safe fixes hard.
What should I hand over if I ask someone to fix an expensive AI-generated codebase?
Bring one baseline day of data and a simple summary of what’s expensive: which endpoints are noisy, which queries are slow and frequent, and which jobs run too often. If the code was generated by tools like Lovable, Bolt, v0, Cursor, or Replit and it’s hard to trace what triggers what, FixMyMess can start with a free code audit and then remediate the hotspots with human verification. Most projects are completed in 48–72 hours, with a 99% success rate, and the goal is to turn the demo code into production-ready behavior without surprise bills.