Database connection pool exhaustion: tuning for serverless
Learn why database connection pool exhaustion can happen even with light traffic, and how to tune pooling for serverless vs long-lived servers to avoid outages.
What connection pool exhaustion looks like in production
Connection pool exhaustion means your app can’t get a database connection when it needs one. Requests pile up, the app waits, then it gives up after a timeout. To users, it looks like the site is randomly breaking.
Most teams first notice it as “everything is slow” even though CPU and traffic look fine. Pages that normally load in a second hang for 10 to 30 seconds, then fail. It often hits sensitive flows first: login, checkout, saving a form.
User-facing symptoms tend to look like this:
- Pages are slow and sometimes recover on refresh
- Random 500 errors that disappear and then come back
- Login failures or sessions that drop
- Background jobs that stop making progress
- Mobile apps timing out on simple actions
On the engineering side, the pattern is more specific: request queues grow, more time is spent waiting on the database, and logs show errors like “timeout acquiring connection.” On the database, active connections may sit near the limit or spike in short bursts.
The confusing part is the mismatch: traffic can look “light” while the system is stuck waiting.
A common cause is that a small number of requests hold connections longer than expected. One slow query, a transaction left open, or code that forgets to release a client can block the pool. After that, even a handful of users can trigger a mini traffic jam.
Why it happens even under light traffic
“Users online” is not the same thing as “active database connections.” Most databases allow fewer concurrent connections than people assume, and each connection costs memory and CPU.
With Postgres, max_connections is often set conservatively. Even a limit like 100 can be too high in practice if each connection is heavy. Add in admin tools, background workers, migrations, and one-off scripts, and you can run out sooner than expected.
Also, a single request can touch the database multiple times: the main query, an analytics write, a session update, and maybe a job enqueue. If those aren’t managed carefully, “light traffic” still creates a lot of concurrent work.
Pool exhaustion usually comes from one (or more) of these:
- Leaked connections after errors or timeouts, so they never return to the pool
- Slow queries that hold connections longer, forcing other requests to queue
- Retries that multiply traffic (client retries, server retries, ORM retries)
- Background noise like bots, cron jobs, health checks, queue polling
- Startup tasks or migrations opening extra connections at the worst time
A concrete example: you have 10 users, but one endpoint sometimes runs a 4-second query. With a pool of 10, a small burst (from refreshes, retries, or a bot) can occupy every connection. New requests then wait, hit the pool timeout, fail, retry, and make the spike worse.
Outages under “light traffic” are usually about connection lifetime and concurrency, not raw request count.
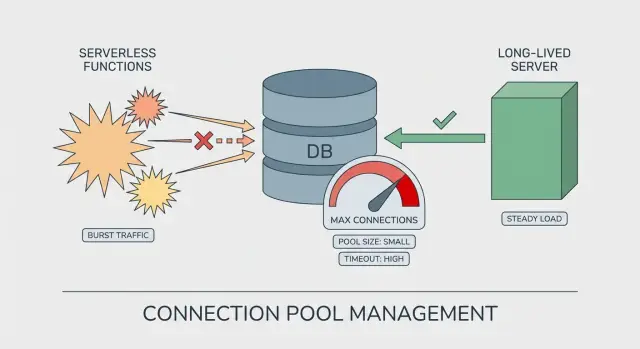
Serverless vs long-lived servers: the pooling difference
On a long-lived server (VM, container, classic app server), the process stays up for hours or days. The database pool is reused across many requests. It “warms up,” settles into a steady pattern, and you can reason about how many connections exist at any moment.
Serverless is different. Your code may run in many short-lived instances. Each instance can create its own pool, even if it only handles a handful of requests. That’s how pool exhaustion shows up with what looks like light traffic: the traffic is spread across more instances than you expected.
Why serverless multiplies connections
The jump usually comes from cold starts and scaling events. When the platform wants more parallelism, it starts more instances, and each instance can open its own set of database connections.
A pool size that feels safe on a server can be risky on serverless:
- Long-lived server: 1 instance x pool of 20 = about 20 connections
- Serverless burst: 30 instances x pool of 20 = about 600 connections
Even if that burst is brief, it can be enough to hit Postgres limits, slow queries, and timeouts.
A simple way to think about it
On long-lived servers, you tune the pool for steady reuse and throughput. On serverless, you tune it for blast radius: assume there may be many copies of your app running at once.
Numbers to gather before you change settings
Guessing at pool settings turns small problems into production incidents. Before you tweak anything, collect a few numbers so you know whether you’re short on connections, holding them too long, or both.
Start with the database limit. Find Postgres max_connections, then list who uses them: your app, admin tools, background jobs, migrations, BI tools, read replicas. Many teams think they have “100 connections” when 30 are already spoken for.
Next, focus on concurrency, not daily traffic. A site with 200 users per day can still spike to 20 concurrent requests if one page triggers multiple API calls or a few people refresh at the same time. Look at peak concurrent requests during your busiest 5 to 15 minutes, and break it down by instance (or by function in serverless).
Query speed matters as much as connection count. Pull slow queries by total time and by p95/p99 latency. A few 2 to 5 second queries can pin connections long enough to block everything else.
The signals that usually explain “sudden” outages:
- Open connections vs Postgres limit, and how fast they grow
- Connection wait time (time spent waiting for a free connection)
- Pool timeouts and error bursts (frequency and timestamps)
- Request concurrency at the moment errors start
- Whether background workers share the same database and pool
A quick reality check: if your pool acquisition timeout is 10 seconds and you see 12-second end-to-end API latency, users blame “the server” while the real delay is waiting for a connection.
Step-by-step: tuning pooling for long-lived servers
On long-lived servers (VMs, containers, always-on pods), the biggest trap is forgetting that each process can have its own pool. Ten web workers with a pool size of 20 is not 20 connections, it’s up to 200.
Start with a target that leaves headroom under your database limit. If Postgres allows 100 connections, you rarely want your app to be able to take all 100. Leave space for migrations, admin sessions, background tools, and deploys.
1) Set a pool size that matches real concurrency
Think in terms of “how many queries run at the same time,” not “how many users.” Slow queries make each checked-out connection last longer, which increases the pool you need.
A practical approach is to set a total connection budget for the whole app (often 60% to 80% of the DB limit), then divide it across processes that can connect. Start small and only raise it if you see queueing and the database still has headroom. Budget separately for job workers.
2) Add timeouts that fail fast (and recover)
Two settings prevent silent pileups: acquisition timeout (how long a request waits for a free connection) and idle timeout (how long an unused connection stays open). Short acquisition timeouts turn a slow meltdown into a visible, contained error you can alert on.
If you have to choose, a smaller pool with clear timeouts is safer than a large pool that pushes the database into overload.
3) Cap concurrency above the pool
If your server can accept 500 concurrent requests but your total DB budget is 60 connections, you need a cap: worker count, request concurrency, or job runner parallelism.
Then verify connections are always returned, including error paths. Look for missing finally blocks, abandoned transactions, or long-lived ORM sessions.
Step-by-step: tuning pooling for serverless
Serverless changes the math. The code may look the same, but the platform can create many short-lived instances at once.
1) Set hard caps per instance
Make each instance “small” from the database’s point of view. In many serverless setups, you don’t want a large pool inside each function.
Keep it simple:
- Limit pool size to a low number (often 1 to 4 per instance)
- Use a short acquire timeout so requests fail fast instead of piling up
- Use an idle timeout so unused connections close quickly
- Reuse the pool across invocations (create it once, outside the request handler)
- Make sure every query releases the connection, even on errors
Sanity check: if Postgres allows 100 connections and the platform can spin up 50 instances, a pool size of 5 can attempt 250 connections. That’s enough to break production.
2) Control concurrency before you touch the database
Your best “pool” is often a concurrency limit. Cap how many requests one service version can run at the same time. This stops a new deploy, retry storm, or burst of background jobs from flooding the database.
Watch for hidden parallelism too: batching with Promise.all, webhook handlers that fan out, queue consumers that process multiple messages at once. These can multiply connections even under light user traffic.
3) Use an external pooler or managed proxy when possible
If your platform offers a database proxy (or you can run an external pooler), it can absorb serverless scale-out and keep database connections stable. Still, know the limits: the proxy can run out of its own capacity, or it can queue requests longer than your function timeout.
A realistic failure mode is “new pool per request” plus retries. Ten concurrent invocations can become 30 connection attempts in seconds.
Guardrails that prevent small issues from becoming outages
Most pool-exhaustion incidents start as a small slowdown. A few requests wait a bit longer, then everything piles up. Guardrails are about failing fast, backing off, and keeping the app usable while the database recovers.
Decide on clear failure behavior. If a request can’t get a connection quickly, it should stop and return a clear error, not hang until it times out upstream. Short pool timeouts also protect your workers because they free up threads so your service can keep responding.
Retries need strict limits. Retrying every failed query can turn a brief hiccup into a stampede. Keep retries to safe operations (like idempotent reads), add jitter (random delay), and cap total retry time.
Circuit breakers are the next step. When you see repeated DB failures, open the breaker for a short window and fail new DB-dependent requests immediately. It’s better to fail quickly than to drag the whole system into a slow collapse.
Graceful degradation keeps users moving. Depending on your product, that might mean read-only mode when writes fail, serving cached results for common reads, temporarily disabling heavy features like reports, or returning a friendly “try again in 30 seconds” message for DB-only endpoints.
Alert on early signals, not just hard errors. Rising connection wait time, growing queue depth, and higher p95 latency often show up minutes before “too many connections.”
Common mistakes that trigger sudden pool exhaustion
Most pool-exhaustion incidents aren’t caused by a huge traffic spike. They happen when a few small choices stack up and remove your safety margin.
One common trap is sizing the app pool to match the database limit. If Postgres allows 100 connections and you set your pool to 100, you’ve left no room for migrations, background workers, admin tools, or a second copy of the app during a deploy.
Serverless scaling is another frequent cause. If each function instance creates its own pool, you don’t have “one pool of 20.” You have “20 times N instances,” which can turn light traffic into a connection storm in seconds.
The mistakes that most often trigger a sudden failure:
- Using the DB max as the app pool size instead of reserving headroom
- Creating a separate pool per serverless instance (or per request)
- Leaking connections on error paths (early returns, exceptions, cancelled requests)
- Holding connections too long (slow queries, missing indexes, long transactions)
- Letting background noise compete with real users (health checks, cron jobs, queue polls)
A realistic pattern is an “idle” app where a health check hits every few seconds, a cron job runs every minute, and one slow query takes 10 seconds. With a small pool, just a couple overlaps can fill it.
Quick pre-release checklist
A lot of incidents labeled as connection pool exhaustion are really missing “last mile” checks: limits are unknown, timeouts are inconsistent, and concurrency is left to chance.
First, write down the hard ceiling. Postgres has a max connection limit, and managed providers often reserve some connections for admin work. If you don’t know your usable max, you can’t size pools safely.
Before release, confirm:
- Your connection budget:
max_connections, reserved connections, and the target cap for the app - Pool size and timeouts with headroom, including a clear acquire timeout
- Concurrency settings (especially in serverless) so one deploy can’t create a wave of new connections
- The slowest queries and the top fixes (indexes and accidental N+1 queries are common)
- Visibility: dashboards and alerts for connection count, connection wait time, and pool timeouts (not just generic 500s)
One practical test: run a small load test that matches “light traffic” (a few users clicking around), then watch pool wait time and active connections. If either climbs steadily, you’re already close to an incident.
A realistic example: an outage with only a few users online
A small SaaS had a quiet Tuesday afternoon: six people logged in, a couple dashboard views per minute. Then users reported that login spun forever and the dashboard threw random 500 errors.
In the logs, the app wasn’t “down” in the usual sense. CPU was fine. Memory was fine. The real clue was repeated messages like “timeout acquiring a client” and “remaining connection slots are reserved.” Classic pool exhaustion, even though traffic looked light.
Two small changes shipped together.
First, a new background job ran every minute to refresh a stats table. Second, one dashboard query got slower because of a missing index. That query began taking 8 to 12 seconds, and the job held a connection the whole time.
Then the deployment moved from a single long-lived server to serverless. Nothing about the code looked riskier, but parallelism jumped overnight. A few concurrent page loads plus a few concurrent job runs meant far more connection attempts at once. Each instance had its own pool, so the total number of open connections climbed fast.
The fix wasn’t one magic setting. It was a set of small guardrails:
- Lower per-instance pool size so each instance can’t grab too many connections
- Cap concurrency so the platform can’t create unlimited parallel work
- Shorten pool timeouts so requests fail fast and recover instead of piling up
- Optimize the slow query (add the index and reduce unnecessary joins)
After that, the app stayed stable. Alerts on “pool wait time” and “active connections” gave the team a warning minutes before users felt it.
Next steps: stabilize pooling and get a second set of eyes
If you just fought pool exhaustion, don’t start by tweaking random numbers. Start by naming your operating model: serverless (many short-lived instances), long-lived servers (few stable processes), or a hybrid. Pooling is a different problem in each.
Write down a simple pooling budget that makes it impossible for your app tier to demand more connections than Postgres can safely give. Capture three things: your usable Postgres connection ceiling, your peak instance count (or burst count) and per-instance cap, and your “stop sign” timeouts so requests fail fast instead of piling up.
Then run one focused load test that matches reality. Many teams test high throughput but miss the pattern that triggers exhaustion: brief bursts, slow queries, and retries. Include login/signup flows, your slowest page, and background tasks running at the same time.
If you inherited an AI-generated codebase, it’s worth checking for the common gotchas: “connect per request” patterns, missing cleanup in error paths, and hidden retries that multiply concurrency. If you want a fast sanity check, FixMyMess (fixmymess.ai) offers a free code audit that pinpoints where connections are created, leaked, or held too long, so you can fix the cause instead of guessing at pool numbers.
FAQ
What does “connection pool exhaustion” actually mean?
It means your app is waiting for a free database connection but none are available. Requests queue up, then hit an acquire timeout, and users see slow pages followed by intermittent failures.
Why does pool exhaustion happen even when traffic looks light?
CPU and traffic can look normal because the app isn’t doing more work; it’s mostly waiting. A few requests holding connections longer than expected can block the whole pool, so even “light” traffic can stall.
What are the most common user-facing symptoms in production?
Look for long hangs (often 10–30 seconds) followed by 500 errors, login failures, or background jobs that stop progressing. Refreshing sometimes “fixes” it briefly because a connection gets freed, then it returns when the pool fills again.
How do connection leaks usually happen in real code?
Leaks happen when code checks out a connection but doesn’t return it on every path, especially error paths. Unhandled exceptions, early returns, cancelled requests, and missing cleanup logic are common ways connections get stuck.
Is the real issue “too many users,” or something else?
Think in terms of concurrency and connection “hold time.” A pool can handle a small number of concurrent queries; if queries are slow or transactions stay open, each request holds a connection longer and the pool runs out sooner.
How is pooling different on serverless compared to long-lived servers?
On long-lived servers, a pool is reused inside a stable process, so total connections are easier to predict. In serverless, many short-lived instances can spin up at once, and each one may create its own pool, multiplying total connections quickly.
What numbers should I gather before changing pool settings?
Start with your database limit (like Postgres max_connections) and subtract connections reserved for admin sessions, migrations, and background workers. Then measure peak concurrent requests, connection wait time, and which queries are slow at p95/p99, because those numbers explain most “sudden” incidents.
What timeouts and guardrails prevent a slow meltdown?
Set an acquire timeout so requests fail quickly instead of piling up, and add an idle timeout so unused connections don’t linger. Then cap request and job concurrency so your app can’t accept far more parallel work than your database connection budget can support.
What are the biggest mistakes that trigger pool exhaustion?
Avoid sizing your app pool equal to the database max, because deploys, migrations, admin tools, and workers still need connections. Also avoid creating a new pool per request, letting retries run wild, and running slow queries inside long transactions that hold connections longer than necessary.
How do I quickly stabilize an AI-generated app that keeps exhausting the pool?
Start by checking for “connect per request,” missing cleanup on errors, hidden retries, and slow queries holding transactions open, because AI-generated prototypes often include those patterns. If you want a fast second opinion, FixMyMess can audit the codebase and point out exactly where connections are created, leaked, or held too long so you can fix the cause instead of guessing pool numbers.