Set up source maps safely to read production frontend errors
Learn how to set up source maps safely so production frontend errors map back to the exact file and line, without exposing your source code.
Why production frontend errors are hard to read
Production frontend errors usually arrive as a short message plus a stack trace that looks specific, but doesn’t tell you what actually broke.
A typical report might look like this:
TypeError: Cannot read properties of undefined (reading 'name')
    at t (app.3f9c1a2b.js:1:28417)
    at e (app.3f9c1a2b.js:1:29102)
    at HTMLButtonElement.<anonymous> (app.3f9c1a2b.js:1:30511)
Those filenames and line numbers are real, but they point to the final bundle your users download, not the files you edit. In production builds, code is minified (names shortened, whitespace removed), reordered, and often split across chunks. That helps load speed, but it makes crashes hard to read.
Minification also removes useful clues. Function names turn into single letters, many statements get packed onto one line, and multiple original files can end up merged into one output file. So when the stack trace says app.3f9c1a2b.js:1:28417, that location might map to a React component, a shared utility, or a bundled library sitting next to your code.
What you want is simple: readable, exact file and line information, without making it easy for the public to download your source. That’s why teams set up source maps safely, so monitoring tools can translate minified stack traces back to your original code.
This matters most when you don’t have time to guess:
- a production outage where every minute costs you users
- a rushed hotfix where you need the smallest safe change
- a bug that happens only on one browser or device
- an issue that appears only after a deploy (release mismatch)
- a customer report with limited details
If you inherited an AI-generated frontend, it can be worse. Bundles often hide tangled logic, and a clean pointer to the exact file and line is the difference between a quick patch and hours of trial and error.
Source maps in plain language (what they do and what they contain)
A source map is a small “decoder” file that tells a browser (and an error tracker) how a minified production bundle maps back to the original source.
That’s why an error can point to app.8f3a1c2.js:1:53241 instead of src/components/CheckoutButton.tsx:47. Source maps bridge that gap by translating bundle line:column into the original file, line, and column.
What’s inside a source map (and why you should care)
Source maps can include more than line numbers:
- file paths to your original modules (like
src/pages/login.tsx) - symbol names (function and variable names)
- the original source code itself via
sourcesContent(the biggest security risk)
Embedding sourcesContent is convenient because debugging works even if the repo isn’t available to the tool doing the mapping. But if the map leaks, your real code can leak with it.
Treat source maps like internal artifacts, not public assets.
What source maps can and cannot do
Source maps help you locate the problem fast. They don’t fix the problem.
If a user hits “Pay” and you see “Cannot read properties of undefined,” a source map won’t prevent the bug. It will tell you which file and line tried to read that missing value, so you can add the right guard, handle an empty state, or fix the data flow.
Make a safe plan before you generate anything
Source maps work best when you decide up front who should be able to access them. Many teams generate maps “just in case,” then accidentally ship readable source to every visitor.
Keep production fast, keep debugging readable
You can keep production bundles fully minified for users and still get readable stack traces for your team. Source maps are for debugging, not performance.
If you’re already chasing crashes in production, focus first on the debugging path: how you’ll collect stack traces, and how you’ll resolve them back to original code.
Decide where maps live and who can access them
Before you generate anything, choose a hosting model that matches your risk level:
- Public web server: easy to wire up, easiest to expose by accident.
- Private storage: maps are not reachable by normal users; only your tooling can fetch them.
- Access control: limited to your team, CI, and error monitoring.
- Retention: keep maps only as long as you need them.
Then decide what to include. If you embed sourcesContent, the map can contain your full source. Many teams strip sourcesContent and rely on private repos or private storage when resolving errors.
Step by step: generate and verify source maps
Think of source maps as build artifacts you can create anytime, but only share when you choose.
1) Turn on source map generation in your build tool
Most build tools have a single setting for this. Look for sourcemap, sourceMap, or devtool. For production debugging, prefer full maps (not “cheap” maps) so line and column numbers match what you see in real error logs.
If your app produces multiple bundles (main app, vendor, chunks), make sure maps are generated for all outputs.
2) Build locally and confirm the .map files exist
Run the same command you use for a real production build. Inspect the output folder and confirm you see files ending in .map.
Each minified JavaScript file should reference its map, usually with a comment near the end:
//# sourceMappingURL=app.abc123.js.map
If that comment is missing, many monitoring tools won’t match stack traces to sources.
3) Sanity check that the map matches the bundle
Pick one bundle and its map and confirm:
- the
.mapfile is valid JSON - the map has a
filefield that looks like the bundle name - the map has non-empty
sources
A practical check: open the minified file in browser devtools. If the map is present, the Sources panel should show original filenames and let you jump to real locations.
4) Record the exact build version you ship
Before you deploy, record the commit hash, build ID, or release tag for this output and keep it with the artifacts. Later, that label is how you find the correct map for a given production stack trace.
Avoid overwriting old source maps without a version label.
Step by step: publish source maps privately for error tracing
Publishing source maps doesn’t mean putting them on your public site. The safest approach is to generate them during the build and upload them only to your error monitoring tool so it can de-minify stack traces.
1) Pick a release naming scheme you won’t change
Your monitoring tool needs a consistent release value to match errors to the right source maps. Keep it boring: a git SHA, or something like [email protected]+build.417.
Use the same value in three places: your build pipeline, your deployed frontend, and your monitoring upload step.
2) Upload source maps to the monitoring tool, not the web server
A common flow:
- build assets with source maps enabled (keep
.mapfiles as artifacts) - deploy only the minified JS bundles to production (without
.mapfiles) - upload
.mapfiles to the monitoring tool under the same release/version - configure the tool with the bundle URL path it should match against
- trigger a test error in staging to confirm it resolves to real file names and line numbers
Some tools take a minute to process maps, so test after a short delay.
3) Make sure the tool can match paths exactly
Most “missing source map” failures are path mismatches. The monitoring tool matches what the browser reports to what you uploaded.
If mapping doesn’t work, check:
- bundle names match exactly (including hashes)
- the configured URL prefix matches your CDN or asset base path
- you uploaded maps from the exact build that’s deployed
- you aren’t reusing old release identifiers
How to avoid leaking code when using source maps
Source maps are great for production debugging, but they can expose your app’s source if you publish them carelessly. A safe default: don’t make .map files publicly downloadable unless you’re genuinely fine with anyone reading your client code.
Keep .map files off the public internet
Two approaches cover most teams:
- Don’t deploy
.mapfiles at all; upload them only to your error tracker. - Block requests for
*.mapat your CDN or web server.
Sanity check: open your site in an incognito window, guess a likely map URL (like app.js.map), and confirm it returns 404 or forbidden.
If you must host maps, lock them down
If you need to self-host maps for custom tooling, require authentication and limit who can reach them. A VPN-only endpoint, IP allowlists, or signed URLs with short expiry are all reasonable.
Also remember: even if your bundles don’t link to maps via sourceMappingURL, a public .map file is still a leak if it’s reachable.
Reduce what the map contains (when risk is high)
If your tooling allows it, consider stripping sourcesContent so the map contains mappings but not the full source text. You still get line-level pointers without handing out the code.
How to trace a minified stack trace back to the exact line
A minified stack trace looks useless because it points to short filenames and tiny functions, plus a line and column that don’t match your source.
Start by finding the first stack frame that belongs to your app (not the browser, extensions, or third-party scripts). You’re looking for a bundle filename and a position, like:
at t (app.3f2c1.js:1:28491)
That :1:28491 is the key. With source maps available to your tool (or to a local mapping step), translate that bundle location into a real file, line, and column.
Once you land on the mapped line, don’t stop at the statement that throws. Scroll up to see what values were passed in. Many “undefined” errors are caused earlier.
A simple way to work the trace:
- map the topmost in-app frame from bundle line:column to source line:column
- open the mapped file and find the exact statement
- check the caller frame to see what arguments were passed
- add a small breadcrumb (log, metric, or guard) to confirm the bad value
- decide: quick patch now, or a deeper refactor if the pattern keeps repeating
Example: the stack says app.3f2c1.js:1:28491. After mapping, you land in src/components/CheckoutButton.tsx:42:17 on user.profile.name.trim(). The real bug isn’t “trim failed.” It’s that user.profile is sometimes missing.
Example: turning “Cannot read properties of undefined” into a fix
A common story: everything looks fine in staging, then after a production deploy you see a spike in “Cannot read properties of undefined (reading 'name')”. It happens only for some users, so it’s hard to reproduce.
Without source maps, the error report often looks like this:
TypeError: Cannot read properties of undefined (reading 'name')
    at tI (app.3f2c1a9.js:1:184233)
    at nA (app.3f2c1a9.js:1:186901)
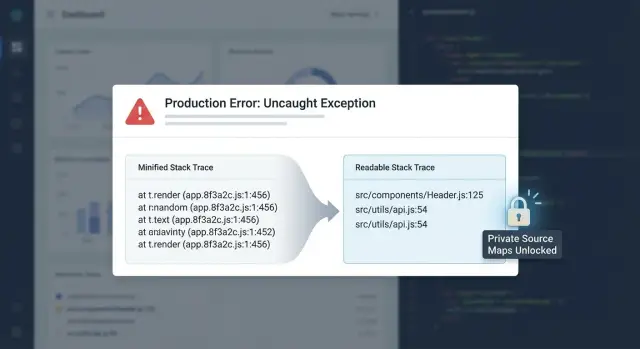
With correct source maps uploaded privately to your monitoring tool, the same crash becomes readable:
TypeError: Cannot read properties of undefined (reading 'name')
    at renderUserBadge (src/components/UserBadge.tsx:42:17)
    at ProfileHeader (src/pages/Profile.tsx:118:9)
Now you can open UserBadge.tsx and see the bad assumption:
// UserBadge.tsx (before)
export function UserBadge({ user }: { user: any }) {
  return <span>{user.profile.name}</span>;
}
For some users, profile is missing (new account, partial API response, cached data), so user.profile is undefined and reading .name crashes.
The smallest safe fix is to handle the missing shape and show a fallback:
// UserBadge.tsx (after)
export function UserBadge({ user }: { user: any }) {
  const name = user?.profile?.name;
  return <span>{name ?? "Anonymous"}</span>;
}
To reduce repeats, add one guardrail:
- validate the API response and fill defaults before rendering
- tighten types so optional fields must be handled
- add a test case for “new user with no profile”
Common mistakes that break source maps (or expose them)
Source maps are only useful when they match the exact JavaScript users ran. They’re also easy to leak if you deploy them like any other static file.
1) The map doesn’t match the deployed build (hash mismatch)
If you upload source maps from a different build than what’s in production, monitoring tools will show wrong line numbers, nonsense filenames, or fail to map at all. This often happens when CI builds twice: once for deploy and once for uploading maps.
Quick check: open the deployed .js file and look for the sourceMappingURL comment. If it points to a map you didn’t upload (or the hashes don’t match), mapping won’t work.
2) Wrong publicPath or asset URL (lookups fail silently)
Even correct maps won’t resolve if the URLs don’t match reality. Common causes: using a CDN in production but leaving a local path in config, or serving your app from /app/ while assets assume /.
Symptoms: .map requests return 404/403, or the monitoring tool reports missing artifacts. Fix by making sure the app reports the real asset base URL for production builds, and that the path your tool uses matches the deployed bundle URLs.
3) Accidentally shipping maps to users
If your deploy step uploads the whole dist/ folder, you may publish your source maps to anyone who knows where to look.
Good defaults are: don’t deploy .map files at all, or restrict access to maps at the edge.
4) Missing release/version tagging (errors map to the wrong code)
Without a clear release identifier, your monitoring system can attach today’s errors to yesterday’s source maps, especially if filenames are reused (like app.js).
Make release tagging non-optional in CI: one release per deploy, and upload the matching artifacts under that same release.
Quick checklist and next steps
Before you ship, do a short pass that covers build accuracy, security, and one real debug test:
- record a unique release ID and use it consistently (build, deploy, monitoring upload)
- confirm maps are generated for the production build
- upload maps privately to your monitoring provider
- confirm
.mapfiles aren’t publicly accessible - trigger one controlled test error and verify it resolves to a real file and line
If you’re dealing with an AI-generated app that ships broken builds, inconsistent releases, or unreadable production errors, FixMyMess (fixmymess.ai) can help by diagnosing the codebase, fixing logic and security issues, and getting error monitoring and source map handling working without exposing your source. They offer a free code audit before any commitment.
FAQ
What is a source map, in plain terms?
A source map is a small file that translates a position in your minified bundle (line and column) back to the original file and line in your real source. It lets error reports point to something like src/components/UserBadge.tsx:42 instead of app.3f2c1a2b.js:1:28417.
Why do production stack traces look useless compared to local errors?
Minification and bundling change your code before users download it, so the stack trace points into the final bundle, not your original files. Names get shortened, many statements end up on one line, and multiple files can be merged, so the trace looks “specific” but isn’t directly actionable without mapping.
What’s the safest way to use source maps in production?
The safest default is to generate source maps during your build but not deploy the .map files to your public site. Instead, upload them only to your error monitoring tool so it can de-minify stack traces privately.
Can source maps leak my code?
They can, especially if the map includes sourcesContent, which may embed your full source code. Treat source maps as internal artifacts, and assume that if a .map file is publicly reachable, someone can inspect what’s inside.
How do I quickly verify my source maps actually work?
First, build your production bundle and confirm .map files exist next to the minified .js files. Then open the minified bundle in browser devtools; if mapping is working, you should see original filenames in the Sources panel and be able to jump to real lines.
Why does my error tracker say “missing source map” even though I generated them?
The most common issue is a mismatch between what users ran and what maps you uploaded, often caused by building twice or overwriting artifacts. Path mismatches are also common, where the monitoring tool can’t match the reported bundle URL to the uploaded files.
What is “release” or “version tagging,” and why does it matter for source maps?
Use a single release identifier that you keep consistent across build, deploy, and source map upload, such as a git SHA or a version plus build number. If releases are reused or missing, today’s errors can get mapped to yesterday’s code and the output becomes misleading.
How do I trace a minified stack trace back to the exact file and line?
Start with the first stack frame that belongs to your app’s bundle, then use source maps to translate that bundle line and column into a real file and line. After you land on the mapped line, check the caller and inputs, because the root cause is often earlier than the line that throws.
What’s the smallest safe fix for “Cannot read properties of undefined (reading 'name')”?
A quick guard like optional chaining or a fallback prevents the crash, but you should also fix the upstream data shape so it doesn’t keep happening. In practice, that often means validating API responses, setting defaults before rendering, and tightening types so missing fields are handled intentionally.
Can FixMyMess help if my AI-generated frontend keeps breaking in production?
If you inherited AI-generated code and production errors are hard to interpret, get help setting up private source map handling and reliable release tagging so debugging becomes straightforward. FixMyMess can run a free code audit and then fix the logic, security issues, and deployment setup so production crashes map to real files without exposing your source.