Structured logging for 5-minute debugging in production
Structured logging makes production bugs easier to reproduce fast. Add request IDs, error boundaries, and copy-ready log patterns for 5-minute debugging.
Why production bugs feel impossible to reproduce
A production bug report often looks like this: “It broke when I clicked the button.” No screenshot, no exact time, no user ID, and no clue which device or browser they used. By the time you try it yourself, it works fine.
Production is messy because the exact conditions are hard to recreate. Real users have different accounts, different data, flaky networks, multiple tabs open, and stale sessions. One rare timing issue can turn into a crash that you never see in staging.
Console prints and vague error messages do not survive this environment. A user’s console is not your console, and even if you collect logs, “something failed” does not tell you which request, which feature flag, or which upstream service triggered it. Worse, a single unhandled error can stop the app before it logs the one detail you needed.
The goal is simple: when a report comes in, you should be able to answer three questions in minutes:
- What happened (the event and the user action)
- Where it happened (the exact request, page, and component)
- Why it happened (the error, plus the important context)
This is why structured logging matters. Instead of dumping random sentences, you log consistent events with the same fields every time, so you can filter and follow the story across services and screens.
You do not need a big rewrite to get there. Small changes add up fast: add a request ID to every request, include it in every log line, and catch crashes with error boundaries so you still capture context when the UI fails.
Here’s a realistic example. A founder says: “Checkout sometimes spins forever.” Without better logs, you guess: payment provider? database? auth? With request IDs and consistent events, you can search one ID and see: checkout_started, payment_intent_created, then a timeout on inventory_reserve, followed by a UI error. Now you have a single failing path to reproduce.
If you inherited an AI-generated app where logs are random or missing, this is usually one of the highest return fixes. Teams like FixMyMess often start with a quick audit of what you can and cannot trace today, then add the minimum logging so the next bug is a 5-minute investigation instead of a week of guesswork.
What structured logs are, in plain language
Plain-text logs are the kind you have probably seen before: a sentence printed to the console like “User login failed”. They are easy to write, but hard to use when things break in production. Everyone phrases messages differently, details get skipped, and searching becomes guesswork.
Structured logging means each log line follows the same shape and includes key details as named fields (often in JSON). Instead of a sentence, you record an event plus the context around it. That way you can filter, group, and compare logs like data.
A good log should answer a few basic questions:
- Who was affected (which user or account)
- What happened (the action or event)
- Where it happened (service, route, screen, function)
- When it happened (timestamp is usually added automatically)
- Result (success or failure, and why)
Here is the difference in practice.
Plain-text (hard to search):
Login failed for user
Structured (easy to filter and group):
{
  "level": "warn",
  "event": "auth.login",
  "userId": "u_123",
  "requestId": "req_8f31",
  "route": "/api/login",
  "status": 401,
  "error": "INVALID_PASSWORD"
}
The most useful fields are usually the boring ones you wish you had later: event, userId (or account/team ID), requestId, and status. If you only add four fields, start there. They let you answer: “Which exact request did this user hit, and what did the app return?”
Structure is what makes production debugging fast. You can quickly search all event = auth.login failures, group by status, or pull every log with requestId = req_8f31 to see the full story of one user problem. That is the difference between scrolling for 30 minutes and finding the issue in 5.
Request IDs: the fastest way to trace one user problem
A request ID is a short unique string (like req_7f3a...) that you attach to a single user action. The point is simple: it connects everything that happened for that action, from the frontend click, to the API, to the database query, and back.
Without it, production debugging turns into guesswork. You search logs by time, user, or endpoint and still end up with a pile of unrelated messages. With a request ID, you can filter down to one story and read it in order.
This is correlation: the same ID appears in every log line that belongs to the same request. It is the glue that makes structured logging actually usable when you are under pressure.
Where the request ID should be created
Create the ID as early as possible, then pass it through every layer.
- At the edge (CDN / load balancer) or API gateway, if you have one
- Otherwise at the backend entry point (the first middleware that handles the request)
- If neither exists (common in AI-generated prototypes), generate it in the server handler before any other work happens
Once created, return it to the client in a response header too. When a user says, "It failed," you can ask for that ID or show it in a support screen.
When to reuse vs generate a new ID
Reuse the same request ID for the whole life of one request, including internal calls triggered by it. If your API calls another service, pass the ID along so the trail stays unbroken.
Generate a new ID when you are no longer handling the same request:
- Retries: keep the original ID as a parent, but give each retry its own attempt ID (so you can see repeated failures)
- Background jobs: create a new job ID, and store the original request ID as the "trigger" (so you can connect the job back to the user action)
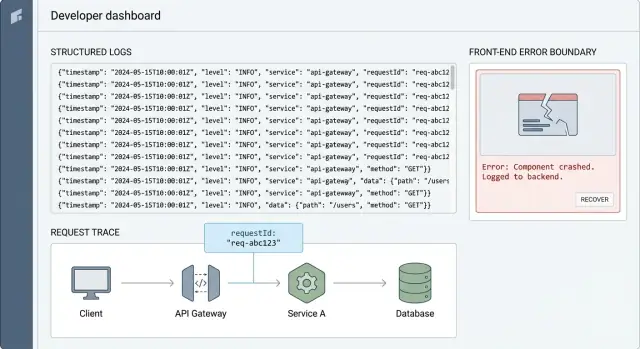
A simple example: a user clicks "Pay" and gets an error. The frontend logs requestId=abc123, the API logs the same abc123 with the route and user ID, and the database layer logs abc123 next to the query and timing. When the payment fails, you can pull up abc123 and see exactly where it broke, usually in minutes.
How to add request IDs end to end (step by step)
A request ID is a short unique value that follows one user action through your system. When support says “checkout failed at 2:14pm”, the request ID lets you pull every related log line in seconds.
Step-by-step setup
Use the same basic pattern in any stack:
- Create (or accept) a request ID at the server edge. If the client already sends one (often
X-Request-Id), keep it. If not, generate one as soon as the request enters your API. - Store it in request context so every log includes it. Put it somewhere your code can read without passing it through every function. Many frameworks have request-local storage. If not, attach it to the request object.
- Return it to the client in the response. Add a response header like
X-Request-Id. This gives support and users something concrete to copy. - Forward it to anything downstream. Add the same header on outgoing HTTP calls, include it in queue/job payloads, and pass it into database wrappers so slow queries can be tied back to the same request.
- Include it in error reports (optional). When you capture exceptions, attach
requestIdso crash reports and logs match. For user-facing errors, you can show a short “support code” derived from the request ID.
Here’s a simple Node/Express-style example. The idea is the same in other languages:
import crypto from "crypto";

app.use((req, res, next) => {
  const incoming = req.header("X-Request-Id");
  req.requestId = incoming || crypto.randomUUID();
  res.setHeader("X-Request-Id", req.requestId);
  next();
});

function log(req, level, message, extra = {}) {
  console.log(JSON.stringify({
    level,
    message,
    requestId: req.requestId,
    ...extra
  }));
}
Once this is in place, your structured logging becomes instantly more useful: every event can be searched by requestId, even if the problem jumps across services.
If you inherited an AI-generated app where logs are random strings (or missing completely), adding request IDs is one of the fastest repairs because it improves debugging without changing business logic.
Designing log events you can actually search
Good logs read like a timeline. When something breaks, you should be able to answer: what happened, to which request, and what decision the code made.
With structured logging, that means every log line is a small record with the same fields every time, not a free-form sentence. Consistency is what makes search work.
Start with a small set of event names
Pick a few core event types and reuse them across the app. Avoid inventing a new name for the same thing each week.
Here are common event types that stay useful over time:
- request_started
- request_finished
- db_query
- auth_failed
- error
Name events in lowercase with underscores, and keep the meaning stable. For example, if you already have auth_failed, do not add login_denied and sign_in_rejected later unless they mean something different.
Log one decision, not one line of code
A simple rule: log when the program makes a decision that changes the outcome. That is the point you will want to find later.
Bad: logging every line around a database call.
Better: one db_query event that tells you what mattered: which model/table (not raw SQL), whether it succeeded, and how long it took.
Always include outcome fields
Make it easy to filter for failures and slow paths. Add a few fields that appear on most events:
- ok: true or false
- errorType: a short category like ValidationError, AuthError, Timeout
- durationMs: for anything timed (requests, db, external API)
- statusCode: for HTTP responses
A realistic example: if a user reports, "checkout fails," you should be able to search for event=auth_failed or ok=false, then narrow by statusCode=401 or errorType=AuthError, and finally spot the slow part by sorting durationMs.
If you are inheriting AI-generated code, this is often missing or inconsistent. At FixMyMess, one of the first repairs we do is normalize event names and fields so production debugging stops being guesswork.
Log levels and volume without drowning in noise
If every event is logged as an error, you stop trusting your logs. If you log everything as debug, you bury the one clue you needed. Good production debugging starts with a simple promise: the default logs should explain what happened without flooding your system.
What each level is for
Think of log levels as a sorting system for urgency and expectedness. In structured logging, the level is just another field you can filter on.
- DEBUG: Details you only want when investigating. Example: a downstream API response time, or the exact branch your code took.
- INFO: Normal milestones. Example: "user signed in", "payment intent created", "job completed".
- WARN: Something went wrong, but the app can recover. Example: retrying a request, using a fallback value, a third-party service returning a 429.
- ERROR: The operation failed and needs attention. Example: an unhandled exception, a failed database write, or a request that returns a 5xx.
A practical rule: if it would wake someone up at night if it spikes, it is probably ERROR. If it helps explain a user complaint later, it is probably INFO. If it is only useful while you have a specific ticket open, it is DEBUG.
Keep volume under control
High-traffic endpoints can create noise fast, especially in AI-generated apps where logging is often added everywhere without a plan. Instead of deleting logs, control the firehose.
Use simple tactics:
- Sampling: Log 1% of successful requests, but 100% of WARN and ERROR. Sampling is most useful on health checks, polling endpoints, and chatty background jobs.
- Rate limits: If the same warning repeats, log it once per minute with a counter.
- One event per outcome: Prefer a single "request finished" log with duration and status over 10 small logs.
Finally, watch performance. Avoid heavy string building or JSON serialization in hot paths. Log stable fields (like route, status, duration_ms) and compute expensive details only when the level is enabled.
Error boundaries: catch crashes and keep useful context
An error boundary is a safety net in the UI. When a component crashes during rendering, a lifecycle method, or a constructor, the boundary catches it, shows a fallback screen, and (most importantly) records what happened. This is how you turn a blank page and a vague complaint into something you can reproduce.
What it catches: sync UI errors that happen while the app is building the page. What it does not catch: errors in event handlers, timeouts, or most async code. For those, you still need normal try/catch and rejected promise handling.
What to log when the UI crashes
When the boundary triggers, log a single event with enough context to search and group similar failures. If you do structured logging, keep the keys consistent.
Capture:
route(the current path) and any important UI state (tab, modal open, wizard step)component(where it crashed) anderrorName+messageuserAction(what the user just did, like "clicked Save")requestId(if you have one from the server or from your API client)buildinfo (app version, environment) so you can match it to a release
Here’s a simple shape:
log.error("ui_crash", {
  route,
  component,
  userAction,
  requestId,
  errorName: error.name,
  message: error.message,
  stack: error.stack,
  appVersion,
});
What users should see vs what developers need
The user message should be calm and safe: “Something went wrong. Please refresh. If it keeps happening, contact support.” Avoid showing raw error text, stack traces, or IDs that might reveal internal details.
Developers, on the other hand, need the full context in logs. A good pattern is to show a short “error code” in the UI (like a timestamp or random token) and log the detailed event with that same token.
On the server, use the equivalent safety nets: a global error handler for requests, plus handlers for unhandled promise rejections and uncaught exceptions. This is where many AI-generated apps fail, and why teams like FixMyMess often find “silent” crashes with no requestId and no useful logs.
If you set this up once, a production crash stops being a mystery and becomes a searchable event you can fix fast.
Logging safely: avoid leaking secrets and personal data
Good logs help you fix bugs fast. Bad logs create new problems: leaked passwords, exposed API keys, and personal data you never meant to store. A simple rule works well: log what you need to debug behavior, not what a user typed.
Never log these (even “just for now”): passwords, session cookies, auth tokens (JWTs), API keys, OAuth codes, private keys, full credit card numbers, CVVs, bank details, and full copies of documents. Also treat personal data as sensitive: email addresses, phone numbers, home addresses, IPs (in many cases), and free-form text fields that might include anything.
Safer alternatives that still let you debug
Instead of dumping full payloads, log small, stable pieces of context that help you reproduce the issue.
- Redact: replace secrets with "[REDACTED]" (do this automatically).
- Partial values: log only the last 4 characters of a token or card number.
- Hash: log a one-way hash of an email to correlate events without storing the email.
- Use IDs: userId, orderId, invoiceId, and requestId are usually enough.
- Summarize: log counts and types ("3 items", "payment_method=card") instead of the full object.
Example: instead of logging a whole checkout request, log orderId, userId, cartItemCount, and paymentProviderErrorCode.
Why AI-generated code leaks secrets (and how to stop it)
AI-generated prototypes often log entire request bodies, headers, or environment variables during “debug mode”. That is risky in production, and it is easy to miss because it “works”. Look for common footguns: console.log(req.headers), print(request.json()), logging process.env, or logging the full error object that includes headers.
Protect yourself with two habits: sanitize before logging, and block dangerous keys by default. Create a small “safe logger” wrapper that redacts fields like password, token, authorization, cookie, apiKey, and secret no matter where they appear.
Finally, keep a retention mindset. Store detailed logs only as long as you truly need them for debugging and security reviews. Keep summaries longer, delete raw event details sooner, and make it easy to purge logs for a user when required.
A realistic 5-minute debugging example
A user reports: “I can’t log in. It works on my laptop, but not in production.” You can’t reproduce it locally, and the only clue is a timestamp and their email.
With structured logging and request IDs in place, you start from the user’s report and work backward from one single request.
Minute 1: find the request
Your support or app UI shows a short “Support code” (that is just the requestId). If you don’t have that UI yet, you can still search logs by the user identifier (hashed email) around the reported time, then grab the requestId from the first matching event.
Minutes 2-4: trace the flow and spot the failing step
Filter logs by requestId=9f3c... and you now have one clean story: one login attempt, end to end, across multiple services.
{"level":"info","event":"auth.login.start","requestId":"9f3c...","userHash":"u_7b1...","ip":"203.0.113.10"}
{"level":"info","event":"auth.oauth.callback","requestId":"9f3c...","provider":"google","elapsedMs":412}
{"level":"error","event":"db.query.failed","requestId":"9f3c...","queryName":"getUserByProviderId","errorCode":"28P01","message":"password authentication failed"}
{"level":"warn","event":"auth.login.denied","requestId":"9f3c...","reason":"dependency_error","status":503}
That third line is the whole answer: the database rejected the connection in production. Because the log has a stable event name and fields like queryName and errorCode, you don’t waste time reading walls of text or guessing which stack trace belongs to this user.
If you also have an error boundary on the client, you may see a matching event like ui.error_boundary.caught with the same requestId (passed as a header) and the screen where it happened. That helps confirm the user-visible impact without relying on screenshots.
Minute 5: turn logs into a reproducible test case
Now you can write a tight reproduction that matches reality:
- Use the same login path (Google callback)
- Run against the production-like config (correct DB user/secret source)
- Execute the single failing operation (
getUserByProviderId) - Assert the expected behavior (return a clear 503 with a safe message)
In many “AI-generated” codebases we see at FixMyMess, this exact issue happens because secrets are hard-coded locally, but pulled differently in production. The point of the logs is not more data, it’s the right fields so you can go from one user complaint to one failing step, fast.
Quick checklist, common mistakes, and next steps
When a production issue hits, you want logs that answer three questions fast: what happened, to whom, and where it broke. This checklist keeps your structured logging useful when you are under pressure.
Quick checklist
- Every request gets a
requestId, and it shows up in every log line for that request. - Every error log includes
errorTypeand a stack trace (or the closest equivalent in your language). - Auth and payments (or any money path) have clear “start” and “finish” events so you can spot where the flow stops.
- Secrets and tokens are redacted by default, and you never dump full request or response payloads.
- The same core fields are always present:
service,route,userId(oranonId),requestId, anddurationMs.
If you do nothing else, make sure you can paste one requestId into your log search and see the whole story from the first handler to the last database call.
Common mistakes that waste time
Even good teams fall into a few traps that make logs hard to use when it matters.
- Inconsistent field names (for example
req_id,requestId, andrequest_idall used in different places). - Missing context (an error is logged, but you cannot tell which route, user, or step caused it).
- Logging only on errors (you need a few key “milestone” events to see where a flow stops).
- Too much noise at the wrong level (everything is
info, so real warnings are buried). - Accidental data leaks (tokens, API keys, session cookies, or full payment payloads in logs).
Next steps: pick the top 3 user-critical flows (often signup/login, checkout, and password reset). Add request IDs end to end, then add 3 to 6 searchable events per flow (start, major step, finish, and a clear failure event). Once those are solid, expand to the rest of the app.
If your AI-generated app is hard to debug because logs are messy or missing, FixMyMess can run a free code audit and help add request IDs, consistent event fields, and safer error handling so production issues are easier to reproduce.