Web Vitals debugging for AI-built frontends: pinpoint fixes
Web Vitals debugging made practical: track LCP, CLS, and INP to specific components, fix layout shifts, and confirm gains after each change.
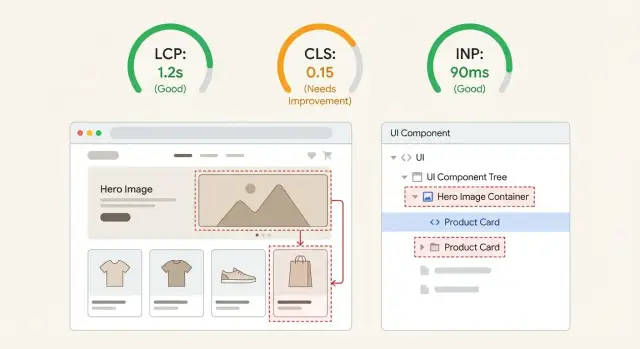
What Web Vitals problems look like in real apps
Bad Web Vitals rarely feel like "a number is off". They feel like a site that looks ready, but isn't.
When LCP is bad, people stare at a blank area or a low-quality placeholder for too long, then the main content suddenly appears. Sometimes it's obvious, like a hero headline popping in late. Sometimes it's subtle, like the product image taking forever while everything else is already visible.
When CLS is bad, the page moves under the user. You try to tap a button, and it slides down because a banner loaded, a font swapped, or an image finally got its height.
When INP is bad, the page looks loaded but feels laggy. Taps and clicks take a beat to respond, inputs stutter, and menus open late.
AI-built frontends often regress after small edits because layout, data fetching, and side effects end up tangled inside the same components. A "tiny" change like adding a badge, swapping a font, or conditionally rendering a promo can shift the initial layout, delay the largest element, or add extra work right when the user interacts.
The goal is straightforward: when a metric spikes, you want to say, "It's this element inside this component, and it got worse after this change." That makes fixes safer, easier to repeat, and easier to verify.
Set up a repeatable baseline before you change anything
Performance work only matters if you can prove you made things better.
Start by keeping your setup consistent: Chrome (stable), DevTools, and a production-like build (minified, same feature flags, same API endpoints if possible). Pick a stable test page where content doesn't change much between runs. If your app needs login, create a dedicated test account with consistent data.
Limit your scope to 1-3 high-value pages. For many AI-built frontends, that's a public landing page (first impression), a pricing page (conversion), and one "money" flow like checkout or a key dashboard screen. If you try to fix everything at once, it's hard to tell what helped.
Keep runs comparable. Use the same device each time, the same network profile in DevTools, and the same steps (fresh tab, hard reload, same clicks). Even small differences, like an extension injecting scripts or a different dataset, can make INP and CLS look better or worse by accident.
Write down your baseline in plain language:
- Date, page, build/commit
- LCP/CLS/INP numbers you saw
- One sentence on what felt wrong (example: "hero image pops in and pushes the headline down")
That note is your reality check later, especially on AI-generated UIs where a "fix" can move the problem to a different component.
Field data vs lab data: when each one is useful
Debugging goes faster when you separate two questions: "What are real users feeling?" and "What can I reproduce and fix today?" Field data answers the first. Lab data answers the second. You usually need both to avoid chasing the wrong thing.
Field data (real user monitoring, analytics, or Chrome UX Report style data) shows trends across devices, networks, routes, and behavior. It's the best way to confirm whether LCP, CLS, or INP is actually bad in production, and for which pages.
Lab data (Lighthouse runs, DevTools Performance recordings, throttled network tests) is where you do the work. It lets you replay the same scenario, inspect what painted, and see which task blocked input. Lab results can be noisy, but they're controllable.
A practical way to combine them:
- Use field data to pick the worst page template and the worst metric (for example, mobile CLS on the landing page).
- Reproduce it in the lab and record until you can trigger the same kind of shift or delay.
- Fix one thing at a time: one component, one image, or one script behavior.
- Verify twice: lab should improve immediately, field should improve over time as users get the new version.
If you can only choose one source to decide what to ship, trust a reproducible lab issue first and use field data as confirmation.
How to trace LCP to the exact element and component
LCP is usually one big thing the user waits to see: a hero image, a headline, a product card, or a full header block. The job is to identify that exact element, then work backward to the component and whatever it's waiting on.
Find the LCP element in a Performance trace
In Chrome DevTools, record a Performance trace while loading the page (incognito helps, and use a normal network profile). In the trace, look for the LCP event marker, then click it to see the reported element.
A simple flow that works on most AI-built frontends:
- Start recording in Performance, then reload the page.
- Find the LCP marker on the timeline.
- Click it and note the LCP element (tag, size, and any image URL).
- Use the highlighted node to jump to it in the DOM.
- Identify which UI block it belongs to (hero, header, above-the-fold card).
Map it back to a component and its dependencies
Once you know the element, ask where it's created. In React/Next.js apps, it's often a Hero component that pulls data, loads an image, and applies styles.
If the LCP element is an image, check whether it's served at the right size and whether it starts downloading early enough. If it's text, pay attention to fonts and CSS.
Then list what the component needs before it can render. Common causes:
- An oversized hero image, or an image without dimensions
- Render-blocking CSS or large font files delaying text paint
- Client-only data fetching that gates the hero (a loading state becomes the "content")
- Heavy JavaScript on first view (hydration work blocks rendering)
One common AI-generated pattern is building the hero from a client fetch to a CMS, which means the hero waits for JavaScript and data. Fixing that one dependency can drop LCP without touching the rest of the page.
How to find the source of layout shifts (CLS)
CLS is the "page jump" score. It happens when something changes size after the page already looks loaded. The browser lays out the page, then a late element appears (or grows), and everything below gets pushed down or sideways.
To catch it, use your browser's layout shift visualization. In Chrome DevTools, record a Performance trace while reloading the page and doing a quick scroll. You'll see "Layout Shift" events in the timeline, plus highlighted regions showing what moved. Click a shift event and look for the "Moved from / Moved to" details and the element that triggered it.
Once you have the element, ask: what changed its size late?
Most CLS bugs come from a small set of patterns:
- Media without dimensions (images, video embeds, iframes)
- Font swaps that change text width and line breaks
- Late banners (cookie consent, promo bars, chat widgets) injected after first paint
- Async blocks (reviews, recommendations, personalized sections)
- Collapsing states (validation errors, accordions) that appear without reserved space
Pick the fix based on the cause. If content must appear, reserve space with explicit dimensions, aspect-ratio, or a placeholder box. If it's optional UI (like a promo bar), show it without pushing the layout, or delay it until the main content is stable.
Example: a landing page loads a hero image with no dimensions, then injects a "Get 10% off" bar after 2 seconds. The trace will show two shifts: one tied to the hero image element, one tied to the banner container. Reserving hero space and making the banner overlay the header usually fixes both.
How to pinpoint interaction delays (INP)
INP is the time between a user action (click, tap, keypress) and a visible response on the page. If someone clicks a button and nothing changes for a moment, that gap is what INP captures.
The fastest way to find the cause is to record a real interaction and look for work that blocks the main thread.
Open DevTools Performance, start a recording, then do the exact action that feels laggy (open a menu, type in a search box, open a modal). Stop the recording and look for a long gap right after the input event, usually shown as long tasks (often 50ms+).
When you spot a long task, connect it back to code by checking what was happening during that window. Common culprits in AI-built UIs:
- Heavy rendering (a whole page rerenders for a tiny state change)
- Large lists or tables (hundreds of rows at once)
- Expensive state updates (deep cloning, sorting, filtering on every keypress)
- Third-party scripts (analytics, chat widgets) running during interactions
- Layout thrash (JS repeatedly reading and writing layout)
Quick triage helps because the fix differs:
- Lag on the first interaction often points to lazy-loaded code, font loading, or a big component mounting for the first time.
- Lag on every interaction usually means repeated render work, noisy state, or event handlers doing too much.
Example: clicking "Add to cart" rerenders the full product grid because cart state lives too high in the tree. INP improves when you isolate state to the cart widget and prevent the grid from rerendering on every click.
Practical fixes that reduce CLS fast
CLS usually drops quickly when you stop the page from changing size after it first appears. The fastest wins are the boring ones: reserve space, keep typography stable, and stop surprise UI from popping in.
Reserve space for anything that loads later
If an image, video, ad slot, or embedded frame arrives without a defined box, the browser guesses, then corrects itself, and everything jumps.
Set explicit dimensions wherever you can. Use width and height on images, or CSS aspect-ratio so the browser knows the shape before the file downloads. If you use skeleton loaders, give them a fixed height that matches the real content.
Stabilize fonts so text doesn't reflow
Late font swaps change line breaks and push buttons down. Keep the fallback font close in size and spacing, and avoid switching font weights after first paint. If a heading jumps when the web font loads, choose a fallback with similar metrics and keep initial styles consistent.
Remove or tame late UI injections
Toasts, cookie banners, chat widgets, and "new message" bars often show up after the page is already visible. Put them in a consistent, reserved spot from the start, or display them as overlays instead of pushing content down.
If you want a short, high-impact pass, focus on:
- Dimensions (or
aspect-ratio) for above-the-fold media - A fixed minimum height for hero sections and skeletons
- Banners and widgets that render into a reserved container
- Avoid inserting new content above the fold after initial paint
Changes that usually improve LCP and INP without a rewrite
When an AI-built UI feels slow, it's often because too much work happens before the first screen is fully visible. It helps to focus on two goals: make the first view lighter (LCP) and make taps and clicks do less work (INP).
A common pattern is a hero wrapped in multiple containers, plus a carousel, background video, and several third-party scripts that all start immediately. It might look fine on a fast laptop, but on a mid-range phone the main thread gets busy and everything arrives late.
Changes that usually help without changing your whole stack:
- Shrink the LCP element. If it's an image, compress it, use WebP/AVIF, and serve the right size for the screen. If it's text inside a heavy wrapper, remove extra layers and expensive effects.
- Simplify above the fold. Cut non-critical animations, shadows, blur effects, and complex widgets in the first viewport. Render the simplest version first, then enhance after.
- Delay non-critical scripts. Load analytics, chat widgets, and A/B tools after the initial render.
- Break up long tasks. If a click triggers a big calculation or rerender, split work so the browser can respond quickly.
- Reduce rerenders. Consolidate state, memoize expensive parts, and stop rerendering the whole page for a small UI change.
For INP, look closely at click handlers. If a button does network calls, validation, and UI updates all in one block, the user waits. Show the UI response first (open the drawer or modal), then do the heavier work.
Measure improvements after each change (without fooling yourself)
It's easy to waste hours by changing something, seeing one good run, and moving on. Web Vitals are noisy. Network timing, CPU load, extensions, and warm caches can make a change look better (or worse) than it really is.
Treat each tweak like a mini experiment: change one thing, then measure. If you batch several changes at once (common in AI-generated frontends), you won't know what actually helped.
A simple log is enough:
- What changed (one small change)
- Where (page/route, component)
- How you tested (device, throttling, cold vs warm load)
- Results (LCP, CLS, INP) using the median of 3 runs
- Evidence saved (trace screenshots)
Compare medians, not best runs. A best run is often luck.
Also watch for trades. You might fix CLS by reserving space, then make LCP worse by loading more CSS early. Or you might improve INP by splitting a component, then introduce a late-loading image that becomes the new LCP. If a fix improves one metric and harms another, decide which user pain is bigger and adjust.
Common traps when debugging Web Vitals in AI-built UIs
Web Vitals work goes sideways fast when the code looks "fine" but behaves differently in production. The biggest mistake is optimizing the score instead of the experience on the pages people actually use.
Traps that waste time and create false wins:
- Chasing Lighthouse points on a single run while real users suffer on login, checkout, or pricing.
- Testing in dev mode and assuming those numbers match production.
- Hiding content, adding delays, or showing skeletons too long so the metric improves but the page feels worse.
- Letting an AI refactor touch dozens of files at once, so when LCP or INP changes you can't tell why.
- Speeding up one page but forgetting to re-check shared layouts and auth flows.
Example: a landing page "fixes" CLS by fading in the hero after 800 ms. CLS improves, but users stare at a blank top section and click the wrong thing when content finally appears. That's a metric win with a product loss.
A few guardrails help:
- Measure the same route, device profile, and network each time.
- Ship one change at a time and confirm navigation and sign-in still work.
- Treat any fix that hides content or delays rendering as suspicious until you confirm it helps users.
Quick checklist for a 30-minute Web Vitals pass
Pick one page and one device profile for today. Testing three pages and two screen sizes burns time and produces fuzzy results.
Do one run and write down what you see before touching code. Your job is to identify the biggest single cause of pain for LCP, CLS, and INP on that page.
- Baseline: record LCP time and the exact LCP element (image, headline, hero section).
- CLS: capture the top 1-2 layout shifts and what moved (hero, banner, font swap, injected widget).
- INP: record the slowest interaction you can reproduce and the long task right after it.
- Quick sweep: check that hero media has fixed dimensions, banners/toasts have reserved space, and third-party scripts aren't blocking first render.
- One change, one rerun: make a single fix, rerun the same test, and record the new numbers.
If the LCP element is the hero image and the page jumps when a cookie banner appears, fix the banner space first (CLS), then lock hero image dimensions and loading behavior (LCP). Don't mix five "small tweaks" in one commit, or you won't know what helped.
Stop when improvements get small, or when the next fix needs refactoring. If the UI was generated by an AI tool and the code is tangled, plan the next bottleneck as a separate block of work.
Example: turning a jumpy AI-built landing page into a stable one
A common AI-built landing page looks fine in screenshots, then jumps when you load it for real: a big hero image at the top, pricing cards below, and a testimonial slider that appears late.
On a project like this, the story became clear after measuring: LCP was the hero image, CLS came from a font swap plus the slider changing height after it loaded, and INP was hurt by a heavy animation library running early.
The sequence that fixed it without a rewrite:
- Lock the hero image size with explicit dimensions or an aspect ratio.
- Reserve space for the testimonial slider with a fixed height (or a predictable min-height).
- Delay or reduce early animations so taps and scroll feel immediate.
To keep yourself honest, record the same things before and after each change:
| Step | What you change | What you record |
|---|---|---|
| Baseline | Nothing | LCP element, CLS total, INP, plus a screen recording |
| After image fix | Hero sizing + load behavior | LCP time and whether LCP is still the hero |
| After slider fix | Reserved height | CLS and what moved |
| After animation change | Delay/reduce animations | INP and first-tap responsiveness |
If you've reserved space, removed the biggest layout shifts, and delayed non-essential work but metrics still bounce around because the component tree is tangled, it's usually faster to restructure that section than to keep poking at symptoms.
Next steps if the frontend is too messy to optimize safely
If you can't reliably map LCP, CLS, or INP back to a specific element and the component that created it, you probably need cleanup before tuning. This work only pays off when you can trace a metric to a concrete cause and verify the impact after a small change.
AI-generated frontends often look fine on the surface but hide a mess underneath: duplicated components, inline styles everywhere, surprise rerenders, and layout changes triggered by late data. In that situation, "quick fixes" can create a new layout shift, or reduce LCP while making INP worse.
A safer path is a short triage pass:
- Pick one page that matters (often the landing page or signup flow).
- Capture a baseline: a few performance traces plus a list of the biggest LCP elements and top layout shifts.
- Identify what you can actually control (one component, one route, one layout system).
- Decide: small refactor first, or deeper cleanup before touching metrics.
Here's a clear signal to stop tweaking and refactor: you change one hero component to fix LCP, but the header starts jumping because spacing is defined in three places (CSS module, inline style, wrapper div). If you can't predict what will move, you're guessing.
If you're inheriting AI-generated code and need it to be stable enough that performance fixes actually stick, FixMyMess works on exactly this kind of remediation: diagnosing messy prototypes built with tools like Lovable, Bolt, v0, Cursor, and Replit, then repairing and refactoring them with human verification. If you want a second set of eyes before investing in a bigger rewrite, their free code audit can help pinpoint what's driving LCP/CLS/INP on your key pages.
Once the codebase is predictable again, go back to the simple loop: baseline, one change, re-measure, repeat.
FAQ
What should I do first before I start fixing Web Vitals?
Start with one page and one device profile so your results are comparable. Use a production-like build, keep the same DevTools network/CPU throttling, and follow the same steps each run so you can trust changes you see.
Should I trust field data or Lighthouse/DevTools more?
Use field data to decide where the real pain is, then use lab tests to reproduce it and fix it. If you can’t reproduce it in the lab, it’s hard to verify a fix, so prioritize issues you can trigger on demand.
How do I find the exact LCP element causing a slow load?
Record a DevTools Performance trace during a page load, then find the LCP marker and click it to see the exact element the browser chose. Once you know the element, track it back to the component that renders it and check what it’s waiting on, like an oversized image, late data, or heavy hydration work.
Why is my hero section usually the LCP problem in AI-built UIs?
If the LCP is an image, make sure it’s the right dimensions for the viewport and starts downloading early, not after client-side data or script work. If the LCP is text, check for render-blocking CSS and slow font loading that delays the first real paint of that headline or hero block.
How can I identify what’s causing my CLS jumps?
Capture layout shift events in a Performance recording and click the biggest ones to see what moved and what triggered it. The fix is usually to stop late size changes by reserving space up front for media, banners, or async sections so the initial layout doesn’t change after it looks ready.
What are the fastest fixes for CLS that actually stick?
Treat it as a stability problem, not a styling problem. Add explicit dimensions or an aspect ratio for images and embeds, keep skeletons the same height as final content, and make late UI like cookie bars or chat widgets appear without pushing the page down.
How do I pinpoint what’s causing a bad INP on clicks and taps?
Record a Performance trace while you do the exact interaction that feels laggy, then look right after the input event for long tasks that block the main thread. The usual fix is to reduce work on that interaction by preventing unnecessary re-renders, splitting expensive code paths, or deferring non-urgent work until after the UI responds.
Why do Web Vitals regress after small UI changes in AI-generated components?
Because small edits can change initial layout, data-fetch timing, and side effects inside the same component, which shifts LCP, CLS, or INP without obvious symptoms in code review. Keeping layout, data loading, and interaction logic separated makes performance more predictable and prevents “tiny” changes from moving the goalposts.
How do I measure improvements without fooling myself?
Change one thing, then measure with the median of three comparable runs on the same setup. Don’t trust a single best run, and watch for tradeoffs where a CLS fix makes LCP worse or an INP fix introduces a new LCP element above the fold.
When should I stop tweaking and refactor or get help?
When you can’t consistently map a metric spike to a specific element and the component that created it, you’re likely guessing and creating new problems. In that case, a short cleanup pass often pays off before more tuning; if you inherited AI-generated code from tools like Lovable, Bolt, v0, Cursor, or Replit, FixMyMess can audit the codebase and help turn the prototype into something stable enough that performance fixes are safe and repeatable.